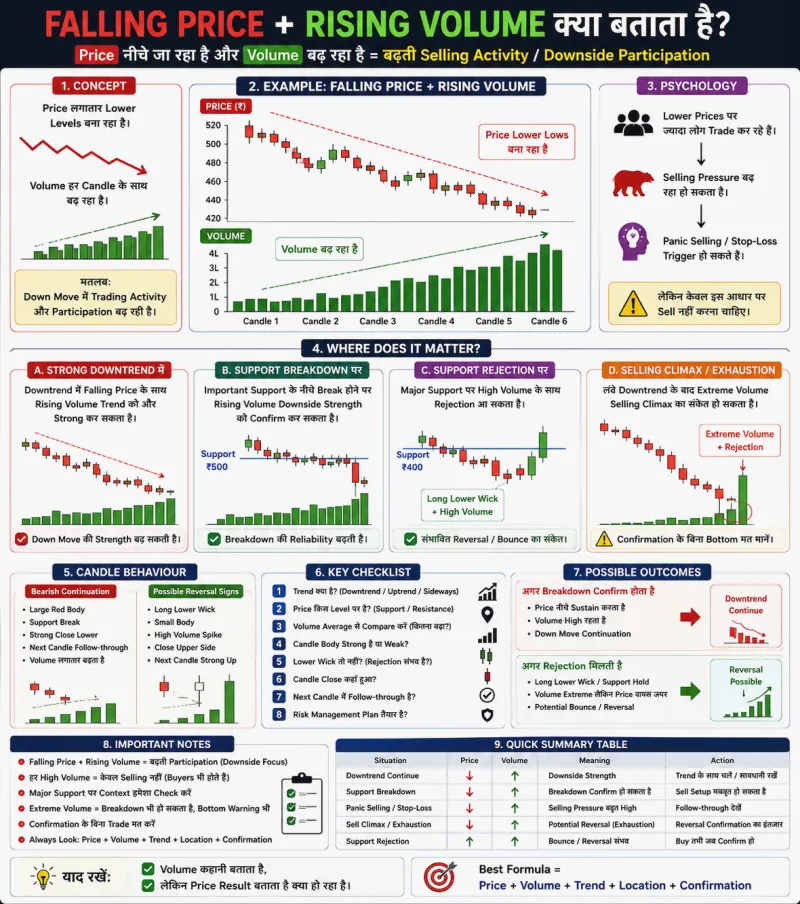
Falling Price + Rising Volume क्या बताता है? पूरी जानकारी हिंदी में
Volume Analysis में अब तक हमने Price के ऊपर जाने के साथ Volume के Behaviour को समझा।
अब इसका दूसरा महत्वपूर्ण हिस्सा है:
Falling Price + Rising Volume
यानी:
Price लगातार नीचे गिर रहा है
और उसी समय:
Volume लगातार बढ़ रहा है।
पहली नजर में इसका मतलब साफ लग सकता है:
“Selling बहुत Strong है।”
लेकिन Volume Analysis में इतनी जल्दी Conclusion निकालना सही नहीं है।
Falling Price + Rising Volume कई अलग Situations में दिखाई दे सकता है:
- Strong Downtrend
- Support Breakdown
- Panic Selling
- Profit Booking
- Stop-Loss Trigger
- Capitulation
- Selling Climax
- Major Support पर Rejection
- Trend Exhaustion
इसलिए सबसे जरूरी सवाल यह नहीं है कि:
Volume बढ़ रहा है या नहीं?
बल्कि:
“बढ़ते Volume के साथ गिरता Price आखिर कहाँ पहुँच रहा है और वहाँ क्या Reaction दे रहा है?”
इसी को आज Zero से Advanced Level तक समझते हैं।
Falling Price क्या होता है?
मान लीजिए किसी Stock का Price:
₹500
₹490
₹480
₹465
₹450
होता जा रहा है।
Price लगातार Lower Levels पर जा रहा है।
इसे सरल भाषा में:
Falling Price
कह सकते हैं।
अगर Market Structure में:
Lower High
और
Lower Low
भी बन रहे हैं, तो यह Downtrend का हिस्सा हो सकता है।
Rising Volume क्या होता है?
अब उसी दौरान Volume देखें:
1 लाख
1.5 लाख
2 लाख
3 लाख
4 लाख
Volume लगातार बढ़ रहा है।
इसका मतलब हर अगले Price Move के साथ Trading Activity बढ़ रही है।
अब दोनों को जोड़ें:
Price ↓ + Volume ↑
यही Falling Price + Rising Volume है।
इसका Basic Meaning क्या है?
इस Combination का सबसे Basic Meaning है:
Down Move के दौरान Market Participation बढ़ रही है।
Price नीचे जा रहा है और Trading Activity भी बढ़ रही है।
यह कई Situations में Downside Move की Strength को Support कर सकता है।
लेकिन:
Falling Price + Rising Volume ≠ Automatic Sell Signal
क्योंकि अगर यही Behaviour लंबे Downtrend के बाद Major Support पर Extreme Volume के साथ दिखाई दे, तो Context बिल्कुल बदल सकता है।
आसान Example
मान लीजिए:
| Candle | Close Price | Volume |
|---|---|---|
| 1 | ₹500 | 1 लाख |
| 2 | ₹490 | 1.5 लाख |
| 3 | ₹480 | 2 लाख |
| 4 | ₹465 | 3 लाख |
| 5 | ₹450 | 4 लाख |
यहाँ:
Price लगातार गिर रहा है।
Volume लगातार बढ़ रहा है।
इसका मतलब Down Move के दौरान Trading Activity Expand हो रही है।
Market Psychology
जब Price नीचे जा रहा हो और Volume बढ़ रहा हो, तो Lower Prices पर लगातार ज्यादा Transactions हो रहे हैं।
लेकिन यहाँ एक बात याद रखें:
Rising Volume का मतलब केवल Sellers बढ़ रहे हैं, ऐसा नहीं है।
हर Completed Trade में Buyer और Seller दोनों होते हैं।
हम Price Behaviour से यह Observe करते हैं कि Heavy Trading Activity के बावजूद Price लगातार Lower Levels पर जा रहा है।
इसलिए इसे:
Downside Participation
के Context में पढ़ा जा सकता है।
Downtrend में Falling Price + Rising Volume
मान लीजिए Market पहले से Downtrend में है।
Structure:
Lower High
↓
Lower Low
↓
Lower High
↓
Lower Low
बना रहा है।
अब Fresh Down Move में:
Price ↓
और
Volume ↑
होता है।
यह Existing Downtrend में बढ़ती Participation दिखा सकता है।
अगर Important Support भी टूट रहा है, तो इसका महत्व और बढ़ सकता है।
Strong Downtrend का Example
Price:
₹500 → ₹470
Volume बढ़ा।
फिर Price:
₹470 → ₹480
छोटा Pullback करता है।
Pullback में Volume कम हो जाता है।
फिर:
₹480 → ₹440
Fresh Down Move आता है।
Volume दोबारा बढ़ता है।
यह Sequence देखें:
Down Move = Higher Volume
Pullback = Lower Volume
Fresh Down Move = Volume Expansion
कुछ Trend Continuation Structures में यह Downtrend Strength दिखा सकता है।
Support Breakdown पर Falling Price + Rising Volume
इस Combination का सबसे महत्वपूर्ण उपयोग Breakdown Analysis में होता है।
मान लीजिए Important Support:
₹300
है।
Price कई बार ₹300 से Bounce कर चुका है।
अब Price:
₹300 के नीचे Break करता है।
Close:
₹292
Volume:
Recent Average से 3 गुना।
अगली Candle:
₹285
और Volume फिर बढ़ता है।
अब हमारे पास:
Support Breakdown
Falling Price
Rising Volume
Strong Close
है।
यह Breakdown में Strong Participation का संकेत हो सकता है।
Strong Breakdown की पहचान
केवल Support के नीचे Price जाना पर्याप्त नहीं है।
एक बेहतर Breakdown Context में Trader देख सकता है:
Important Support
Strong Bearish Candle
Volume Expansion
Support के नीचे Strong Close
Next Candle Follow-through
अगर Price Breakdown Level के नीचे Sustain करता है, तो Context ज्यादा मजबूत हो सकता है।
Breakdown के बाद Retest
मान लीजिए:
Support ₹500 टूट गया।
Price ₹480 तक गिर गया।
Volume Down Move में High था।
अब Price वापस:
₹495–₹500
तक Pullback करता है।
अगर Pullback में Volume कम रहता है और ₹500 के आसपास Price Reject होकर दोबारा नीचे जाता है तथा Volume फिर Expand होता है, तो यह Breakdown Continuation का महत्वपूर्ण Context हो सकता है।
Sequence:
Support Breakdown + High Volume
↓
Retest + Lower Volume
↓
Rejection
↓
Fresh Down Move + Rising Volume
यह अकेली Red Candle से ज्यादा Meaningful है।
Falling Price + Rising Volume और Panic Selling
कभी-कभी Market में अचानक बहुत तेज गिरावट आती है।
Price तेजी से नीचे जाता है।
Volume भी बहुत तेजी से बढ़ता है।
ऐसा:
- Bad News
- Results
- Market Crash
- Unexpected Event
- Stop-Loss Triggering
- Fear
जैसी Situations में दिखाई दे सकता है।
इसे सामान्य भाषा में:
Panic Selling
के Context में देखा जा सकता है।
लेकिन हर High Volume Fall Panic Selling नहीं होता।
Stop-Loss Trigger होने पर Volume
मान लीजिए बहुत से Traders ने Important Support के नीचे Stop Loss लगाए हैं।
Support:
₹500
है।
Price ₹500 Break करता है।
जैसे ही Price नीचे जाता है, कई Stop Orders Trigger हो सकते हैं।
Trading Activity अचानक बढ़ सकती है।
Price तेजी से:
₹500 → ₹490 → ₹480
जाता है।
Volume Spike आता है।
यह Breakdown के दौरान Volume Expansion का एक संभावित कारण हो सकता है।
लेकिन Chart देखकर हम निश्चित रूप से यह नहीं जान सकते कि Volume का कितना हिस्सा Stop Losses से आया।
Major Support पर Falling Price + Rising Volume
अब बहुत महत्वपूर्ण Situation।
मान लीजिए Price लंबे समय से गिर रहा है:
₹600 → ₹550 → ₹500 → ₹450 → ₹410
और Major Support:
₹400
है।
Price ₹400 के पास आते-आते Volume तेजी से बढ़ रहा है।
क्या इसका मतलब:
Support जरूर टूटेगा?
नहीं।
अब Price Reaction देखना जरूरी है।
Situation A: Support Breakdown
Price ₹400 Break करता है।
Strong Red Candle:
₹385 पर Close।
Volume बहुत High।
अगली Candle भी:
₹375
तक गिरती है।
यहाँ Falling Price + Rising Volume Downside Strength को Support कर सकता है।
Situation B: Support Rejection
अब वही Price:
₹400 के नीचे ₹385 तक जाता है।
Volume बहुत High है।
लेकिन Candle Strong Lower Wick बनाकर:
₹410
पर Close करती है।
अगली Candle:
₹420
पर Strong Bullish Close देती है।
यहाँ कहानी बदल गई।
Heavy Activity के बावजूद Price Lower Levels पर Sustain नहीं कर पाया।
इसलिए:
Same Volume + Different Price Result = Different Meaning
Long Lower Wick + High Volume
यह Combination बहुत महत्वपूर्ण हो सकता है।
मान लीजिए Price तेजी से नीचे आया।
Volume बहुत High।
लेकिन Candle की:
Long Lower Wick
है।
और Close Candle के Upper Portion में हुआ।
अब सवाल पूछें:
इतनी ज्यादा Activity के बावजूद Price नीचे क्यों नहीं टिक पाया?
यह Major Support पर महत्वपूर्ण Observation हो सकती है।
लेकिन इसे Automatic Buy Signal नहीं समझें।
Selling Climax क्या हो सकता है?
लंबे Downtrend के बाद कभी-कभी Selling Activity Extreme Level तक पहुँच सकती है।
उदाहरण:
Price:
₹500 → ₹450 → ₹400 → ₹350 → ₹320
Volume धीरे-धीरे बढ़ता गया।
फिर ₹300 के आसपास अचानक:
पूरे Downtrend का सबसे बड़ा Volume
आता है।
Price ₹285 तक जाता है।
लेकिन Strong Recovery करके:
₹315
पर Close करता है।
यह संभावित:
Selling Climax / Capitulation
जैसे Context में दिखाई दे सकता है।
लेकिन सिर्फ Extreme Volume से Bottom Confirm नहीं होता।
Capitulation को आसान भाषा में समझें
जब लंबे Fall के बाद Market Participants Fear में तेजी से Positions Exit करते हैं, तो Extreme Trading Activity दिखाई दे सकती है।
Price बहुत तेजी से गिर सकता है।
Volume बहुत ज्यादा हो सकता है।
इसे कुछ परिस्थितियों में:
Capitulation
कहा जाता है।
लेकिन यह जानना मुश्किल है कि Exact Bottom कहाँ बनेगा।
इसलिए:
High Volume Fall ≠ Bottom Confirmed
Price Confirmation जरूरी है।
Trend के बीच High Volume Fall और Trend के अंत में High Volume Fall
दोनों दिखने में समान हो सकते हैं।
लेकिन Location अलग होती है।
Trend के बीच
Fresh Support Breakdown
Lower Low
Strong Bearish Close
Follow-through
हो सकता है।
यह Continuation Context हो सकता है।
Extended Downtrend के बाद
Major Historical Support
Extreme Volume
Long Lower Wick
Failed Breakdown
Strong Recovery
हो सकती है।
यह Potential Exhaustion Context हो सकता है।
इसलिए:
Location Meaning बदल देती है।
Candle Body और Volume
अब Price Result को Detail में समझते हैं।
Large Red Body + High Volume
Strong Downside Price Progress के साथ High Activity।
अगर Support Breakdown पर है, तो Downside Strength का Context हो सकता है।
Small Body + Very High Volume
बहुत ज्यादा Activity हुई लेकिन Price Progress कम रहा।
यह खासकर Important Level पर ध्यान देने योग्य है।
High Volume लेकिन Price कम गिर रहा है
मान लीजिए Volume:
1L → 2L → 4L → 7L
हो रहा है।
लेकिन Price Fall:
₹20 → ₹15 → ₹8 → ₹2
जैसा छोटा होता जा रहा है।
Volume बढ़ रहा है लेकिन Downside Price Progress कम हो रही है।
अब सवाल है:
बढ़ती Activity के बावजूद Sellers Price को उतना नीचे क्यों नहीं ले जा पा रहे?
यह संभावित Exhaustion/Absorption जैसे Advanced Context की तरफ इशारा कर सकता है।
लेकिन अकेले इससे Reversal Confirm नहीं होता।
Price Progress + Volume Effort
इसे आसान Formula से समझें:
Volume = Activity / Effort
और:
Price Movement = Result
अगर Volume बढ़ रहा है और Price तेजी से गिर रहा है:
High Activity + Strong Downside Result
दिख रहा है।
अगर Volume बहुत बढ़ रहा है लेकिन Price गिरना कम होता जा रहा है:
High Activity + Weakening Downside Result
दिखाई दे सकता है।
यह Difference Advanced Volume Analysis में बहुत महत्वपूर्ण है।
Falling Price + Rising Volume और Support Zone
Support कोई Exact ₹1 Line हमेशा नहीं होता।
कई बार Support:
Zone
हो सकता है।
उदाहरण:
₹395–₹405
इसलिए Price ₹400 के नीचे थोड़ी देर जाने से तुरंत Breakdown मानना सही नहीं।
देखें:
क्या Price Zone के नीचे Close करता है?
क्या Volume Expand होता है?
क्या अगली Candle Follow-through देती है?
या Price वापस Zone के ऊपर Recover करता है?
Sideways Market में Falling Price + Rising Volume
मान लीजिए Range:
Resistance = ₹550
Support = ₹500
Price:
₹540 → ₹525 → ₹510
गिर रहा है।
Volume बढ़ रहा है।
लेकिन Price अभी भी Range के अंदर है।
इसलिए ₹500 के पास Reaction महत्वपूर्ण होगा।
अगर ₹500 Break होता है और Volume Expand रहता है, तो Breakdown Context बन सकता है।
अगर ₹500 से Strong Bounce आता है, तो Analysis बदल जाएगा।
Failed Breakdown
यह बहुत महत्वपूर्ण Concept है।
Support:
₹500
Price:
₹495
तक Break करता है।
Volume बहुत High है।
Beginners सोचते हैं:
“Breakdown Confirm!”
लेकिन Candle वापस:
₹505
पर Close होती है।
अगली Candle:
₹515
चली जाती है।
यह:
Failed Breakdown
का Context हो सकता है।
High Volume के बावजूद Price Support के नीचे Sustain नहीं कर पाया।
इसलिए:
Volume से ज्यादा Price Acceptance महत्वपूर्ण है।
Price Acceptance क्या समझें?
अगर Price Important Support के नीचे Break करने के बाद:
वहीं नीचे Trade करता रहे,
Candles नीचे Close करें,
Retest Fail हो,
और Fresh Selling Move आए,
तो Market Lower Prices को Accept करता हुआ दिखाई दे सकता है।
अगर Price तुरंत वापस Support के ऊपर आ जाए, तो Breakdown कमजोर पड़ सकता है।
Intraday में Falling Price + Rising Volume
5-Minute या Intraday Chart में यह Combination काफी उपयोगी हो सकता है।
लेकिन Opening Session में Volume Naturally High रहता है।
इसलिए केवल:
Red Candle + High Volume
देखकर Short नहीं करना चाहिए।
देखें:
Support टूट रहा है?
Market Structure Bearish है?
Price VWAP/Important Level के नीचे है?
Candle Close Strong है?
Follow-through है?
5-Minute Chart Example
मान लीजिए Support:
₹500
है।
5-Minute Candles:
10:00 — ₹505 Close — Volume 1.0L
10:05 — ₹501 Close — Volume 1.3L
10:10 — ₹496 Close — Volume 2.2L
10:15 — ₹490 Close — Volume 3.1L
10:20 — ₹482 Close — Volume 4.0L
यहाँ:
Price ↓
Volume ↑
और Support ₹500 भी टूट गया।
अगर Price ₹500 के नीचे Sustain करता है, तो Downside Participation का Context मजबूत हो सकता है।
लेकिन अगर अगली Candle वापस ₹505 जाए?
अब बहुत महत्वपूर्ण।
अगर 10:25 Candle:
₹482 से तेजी से Recover करके ₹505 पर Close कर जाए,
और Volume भी बहुत High हो,
तो पहले वाला Breakdown Questionable हो जाएगा।
यानी:
नई Price Information आने पर Analysis Update करें।
Market में कोई Interpretation Permanent नहीं होता।
Falling Price + Rising Volume देखकर क्या करें?
पहले यह मत सोचें:
“Sell करना है।”
पहले Questions पूछें:
Trend क्या है?
Price कहाँ है?
Support कितना महत्वपूर्ण है?
Volume सामान्य से कितना ज्यादा है?
Candle Body कैसी है?
Lower Wick है?
Price कहाँ Close हुआ?
Follow-through मिला?
Breakdown Sustain हुआ?
Reversal की Warning कब मिल सकती है?
लंबे Downtrend के बाद अगर:
Price लगातार गिर रहा हो
Volume Extreme हो जाए
Price Progress कम होने लगे
Major Support हो
Long Lower Wicks आएँ
Breakdown Fail हो
Bullish Structure Change आए
तो Potential Exhaustion/Reversal Context बन सकता है।
लेकिन:
Confirmation के बिना Bottom Guess नहीं करना चाहिए।
Falling Price + Rising Volume पढ़ने का Step-by-Step तरीका
Step 1: Trend पहचानें
Market पहले से Downtrend में है?
Step 2: Structure देखें
Lower High और Lower Low बन रहे हैं?
Step 3: Volume Sequence देखें
Volume वास्तव में बढ़ रहा है?
Step 4: Average Volume से Compare करें
Current Activity कितनी Significant है?
Step 5: Location देखें
Important Support पास है?
Step 6: Candle Body देखें
Strong Downside Progress है?
Step 7: Lower Wick देखें
Lower Prices पर Rejection है?
Step 8: Candle Close देखें
Support के नीचे Strong Close हुआ?
Step 9: Follow-through देखें
अगली Candle Down Move Continue करती है?
Step 10: Exhaustion Signs देखें
Extreme Volume के बावजूद Price Progress कम तो नहीं हो रही?
Common Mistakes
1. Falling Price + Rising Volume = Sell मान लेना
यह Observation है, Automatic Trade Signal नहीं।
2. Major Support Ignore करना
Support पर Same Combination का Meaning बदल सकता है।
3. Extreme Volume को हमेशा Strong Selling समझना
Extended Downtrend में यह Exhaustion Context भी हो सकता है।
4. Lower Wick Ignore करना
High Volume के साथ Strong Lower Wick महत्वपूर्ण है।
5. Candle Close Ignore करना
Price Support के नीचे गया या वहाँ Close भी हुआ?
दोनों अलग बातें हैं।
6. Failed Breakdown Ignore करना
Price वापस Level के ऊपर आ जाए तो Analysis बदल सकता है।
7. केवल एक Candle देखना
Sequence ज्यादा महत्वपूर्ण है।
8. Bottom Guess करना
Extreme Volume देखकर तुरंत Reversal मानना खतरनाक है।
सबसे जरूरी बातें
Falling Price + Rising Volume का Basic Meaning है:
Down Move में Trading Participation बढ़ रही है।
यह:
Downtrend Continuation
और:
Support Breakdown
में Downside Strength दिखा सकता है।
लेकिन लंबे Downtrend के बाद Major Support पर:
Extreme Volume + Rejection + Failed Breakdown
Potential Exhaustion का Context भी बना सकते हैं।
इसलिए:
Falling Price + Rising Volume ≠ Automatic Sell
High Red Volume ≠ केवल Sellers
Extreme Volume ≠ Guaranteed Breakdown
Extreme Volume ≠ Guaranteed Bottom
सही Formula है:
Price + Volume + Trend + Location + Candle Result + Confirmation
निष्कर्ष
Falling Price + Rising Volume Volume Analysis का एक बहुत महत्वपूर्ण Combination है।
जब Price नीचे जा रहा हो और Volume बढ़ रहा हो, तो सामान्यतः Down Move में Market Participation बढ़ती हुई दिखाई देती है।
Fresh Support Breakdown और Existing Downtrend में यह Downside Strength को Support कर सकता है।
लेकिन वही Combination लंबे Downtrend के बाद Major Support पर Extreme Volume, Long Lower Wick और Failed Breakdown के साथ दिखाई दे, तो उसका Meaning बदल सकता है।
इसलिए केवल यह मत देखें:
“Volume कितना बढ़ा?”
सबसे महत्वपूर्ण सवाल पूछें:
“इतनी ज्यादा Activity के बाद Price ने क्या Result दिया?”
अगर बढ़ते Volume के साथ Price लगातार Strong Lower Levels पर Close कर रहा है, तो Downside Result मजबूत है।
अगर Volume Extreme हो रहा है लेकिन Price नीचे टिक नहीं पा रहा, तो सावधानी जरूरी है।
यही सोच आपको Volume Bars देखने से आगे ले जाकर असली Price-Volume Behaviour समझने में मदद करती है।