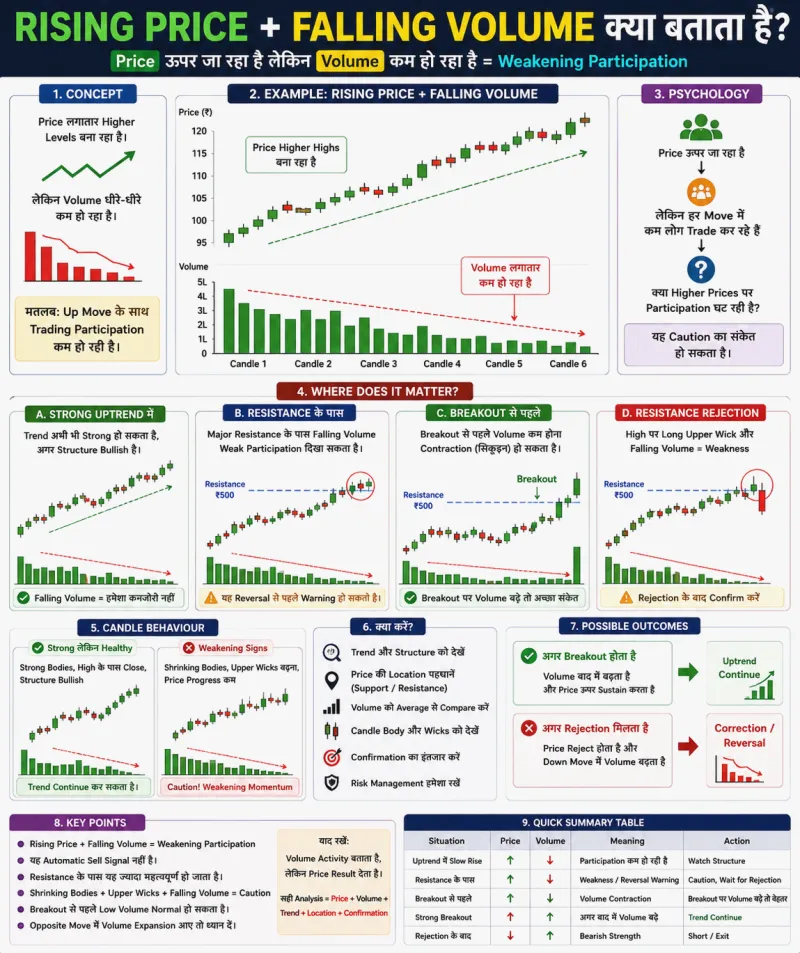
Rising Price + Falling Volume क्या बताता है? पूरी जानकारी हिंदी में
Volume Analysis में एक बहुत महत्वपूर्ण Situation होती है:
Rising Price + Falling Volume
यानी:
Price लगातार ऊपर जा रहा है
लेकिन:
Volume धीरे-धीरे कम हो रहा है।
पहली नजर में यह Situation Confusing लग सकती है।
Price ऊपर जा रहा है तो Market Strong लग रहा है, लेकिन Volume कम हो रहा है तो Participation घटती हुई दिखाई दे रही है।
तो सवाल आता है:
क्या यह Trend Weak होने का संकेत है?
क्या Price अब गिरने वाला है?
क्या Resistance के पास यह Reversal की Warning है?
क्या Strong Uptrend में Falling Volume Normal हो सकता है?
और सबसे महत्वपूर्ण:
Rising Price + Falling Volume देखकर Trade कैसे Analyze करें?
इसे समझने के लिए हमें Price, Volume, Trend, Location और Candle Behaviour को एक साथ पढ़ना होगा।
Rising Price क्या है?
मान लीजिए किसी Stock का Price:
₹100
₹103
₹106
₹109
₹112
तक बढ़ता जा रहा है।
Price लगातार Higher Levels पर पहुँच रहा है।
इसे सरल भाषा में:
Rising Price
कहा जा सकता है।
अब इसी Price Movement के साथ Volume देखें।
Falling Volume क्या है?
मान लीजिए Volume:
5 लाख
4 लाख
3 लाख
2 लाख
1.2 लाख
होता जा रहा है।
यानी हर अगले Move में Trading Activity कम होती जा रही है।
इसे:
Falling Volume
कहा जाता है।
अब दोनों को Combine करें:
Price ↑ + Volume ↓
यही Rising Price + Falling Volume है।
इसका Basic Meaning क्या है?
Rising Price + Falling Volume का सामान्य अर्थ है:
Price ऊपर बढ़ रहा है, लेकिन उस Up Move के दौरान Trading Participation कम हो रही है।
इसे कई Situations में:
Weakening Participation
के रूप में देखा जा सकता है।
लेकिन सबसे जरूरी बात:
इसका मतलब यह नहीं कि Price अब जरूर गिरेगा।
Price Falling Volume के साथ काफी समय तक ऊपर जा सकता है।
इसलिए इसे Automatic Reversal Signal नहीं समझना चाहिए।
आसान Example
मान लीजिए:
| Candle | Close Price | Volume |
|---|---|---|
| 1 | ₹100 | 5 लाख |
| 2 | ₹104 | 4 लाख |
| 3 | ₹107 | 3 लाख |
| 4 | ₹110 | 2 लाख |
| 5 | ₹113 | 1 लाख |
यहाँ:
Price लगातार Higher जा रहा है।
लेकिन:
Volume लगातार Lower हो रहा है।
इससे हमें पता चलता है कि Price Up Move जारी है, लेकिन Trading Activity Expand होने के बजाय Contract हो रही है।
Market Psychology
मान लीजिए Price ₹100 से ₹113 तक पहुँच गया।
लेकिन Higher Prices की तरफ जाते समय Volume:
5 लाख से घटकर 1 लाख
हो गया।
इसका मतलब यह है कि Price Higher Levels पर जा रहा है लेकिन उस Move के साथ Trading Activity बढ़ नहीं रही।
यह सवाल पैदा करता है:
क्या Higher Prices पर Participation कमजोर पड़ रही है?
लेकिन इसका उत्तर केवल Volume देखकर नहीं दिया जा सकता।
हमें Price Behaviour भी देखना होगा।
क्या इसका मतलब Buyers खत्म हो रहे हैं?
सीधे ऐसा कहना सही नहीं है।
Volume कम होने का मतलब:
Trading Activity कम हो रही है।
लेकिन इससे यह साबित नहीं होता कि Buyers अचानक खत्म हो गए।
हर completed transaction में Buyer और Seller दोनों होते हैं।
इसलिए सही Interpretation होगा:
Price ऊपर जा रहा है लेकिन Overall Trading Participation घट रही है।
Uptrend में Rising Price + Falling Volume
मान लीजिए Market Strong Uptrend में है।
Structure:
Higher High
Higher Low
Higher High
Higher Low
बना रहा है।
अब Price धीरे-धीरे ऊपर जा रहा है लेकिन Volume कम हो रहा है।
क्या इसका मतलब Trend खत्म हो गया?
जरूरी नहीं।
अगर:
Price Structure अभी भी Bullish है,
Important Support Hold कर रहे हैं,
कोई Strong Rejection नहीं है,
और Price Higher High बना रहा है,
तो केवल Falling Volume देखकर Reversal घोषित करना जल्दबाजी होगी।
Strong Trend में Volume क्यों कम हो सकता है?
हर Up Move में Volume लगातार बढ़े, ऐसा जरूरी नहीं।
Market में कभी-कभी Price धीरे-धीरे ऊपर Drift कर सकता है।
कई Candles Low Volume पर भी Higher Close दे सकती हैं।
इसलिए:
Falling Volume अकेले Trend Reversal Confirm नहीं करता।
Price Structure ज्यादा महत्वपूर्ण है।
Resistance के पास Rising Price + Falling Volume
अब यह Combination ज्यादा Interesting हो जाता है।
मान लीजिए Major Resistance:
₹500
है।
Price:
₹460 → ₹475 → ₹485 → ₹495
तक पहुँचता है।
लेकिन Volume:
5 लाख → 4 लाख → 2.5 लाख → 1.5 लाख
होता जाता है।
अब Price Resistance के पास पहुँच रहा है लेकिन Participation कम हो रही है।
यह:
Caution
का संकेत हो सकता है।
लेकिन अभी भी Short Signal नहीं है।
Resistance पर Confirmation कैसे देखें?
अब Price ₹500 के पास पहुँच गया।
अगर वहाँ:
Long Upper Wick
बनती है,
Price ₹500 के ऊपर Sustain नहीं करता,
Bearish Candle आती है,
और Down Move में Volume बढ़ता है,
तो Rising Price + Falling Volume के बाद मिलने वाली Price Confirmation ज्यादा महत्वपूर्ण हो सकती है।
Sequence:
Price Rising
↓
Volume Falling
↓
Major Resistance
↓
Price Rejection
↓
Bearish Confirmation
↓
Down Move में Volume Expansion
यह अकेले Falling Volume से कहीं ज्यादा Meaningful Context है।
बिना Confirmation Short क्यों नहीं करना चाहिए?
मान लीजिए Resistance ₹500 है।
Price ₹495 पर है।
Volume कम हो रहा है।
आपने सोच लिया:
“Volume कम है, अब Price गिरेगा।”
लेकिन अगली Candle:
₹500 Break करके ₹510 पर Close कर देती है।
Volume भी अचानक Expand हो जाता है।
अब पहले वाला Weak-looking Move Fresh Breakout में बदल गया।
इसलिए:
Falling Volume Warning हो सकता है, Trigger नहीं।
Breakout से पहले Rising Price + Falling Volume
हर बार यह Negative नहीं होता।
मान लीजिए Stock Consolidation में है।
Resistance:
₹500
है।
Price धीरे-धीरे:
₹480 → ₹485 → ₹490 → ₹495
जा रहा है।
Volume कम होता जा रहा है।
फिर अचानक:
₹500 Break
₹510 Strong Close
और Volume में बड़ा Expansion आता है।
यहाँ Breakout से पहले Falling Volume एक प्रकार के:
Volume Contraction
का हिस्सा हो सकता है।
इसलिए Context बहुत महत्वपूर्ण है।
Rising Price + Falling Volume और Breakout
अगर Price Resistance Break करता है लेकिन Breakout के दौरान भी Volume बहुत कम रहता है, तो Trader Breakout की Quality को ध्यान से देख सकता है।
लेकिन:
Low Volume Breakout = Fake Breakout
यह Universal Rule नहीं है।
देखें:
Price Level के ऊपर Sustain करता है?
Retest Hold करता है?
Follow-through मिलता है?
Volume बाद में Expand होता है?
इन सवालों के जवाब ज्यादा महत्वपूर्ण हैं।
Rising Price + Falling Volume और छोटी Candles
मान लीजिए:
Price ऊपर जा रहा है।
Volume कम हो रहा है।
साथ ही Candles की Bodies भी छोटी होती जा रही हैं।
उदाहरण:
पहली Candle = +₹8
दूसरी = +₹5
तीसरी = +₹3
चौथी = +₹1
यहाँ दो चीजें कम हो रही हैं:
Trading Activity
और:
Price Progress
अगर यह Major Resistance के पास हो रहा है, तो Weakening Momentum/Participation का Context ज्यादा महत्वपूर्ण हो सकता है।
Rising Price + Falling Volume + Upper Wicks
अब मान लीजिए Price ऊपर जा रहा है।
Volume लगातार कम है।
और Higher Levels पर Candles में:
Long Upper Wicks
आने लगती हैं।
इसका मतलब Price Higher Levels तक जा रहा है लेकिन वहाँ Sustain करने में Difficulty दिखाई दे रही है।
अगर यह Major Resistance पर हो रहा है, तो Trader सावधान हो सकता है।
लेकिन:
Upper Wick + Falling Volume = Confirmed Reversal
नहीं है।
Price Structure Confirmation जरूरी है।
Rising Price + Falling Volume लेकिन Strong Candles
अब उल्टा Example।
Price ऊपर जा रहा है।
Volume धीरे-धीरे कम है।
लेकिन Candles:
Strong Bodies
High के पास Close
और:
Higher High
बना रही हैं।
यहाँ केवल Falling Volume देखकर Trend को Weak घोषित करना सही नहीं होगा।
Price अभी भी Efficiently Higher Move कर रहा है।
Price Progress बहुत महत्वपूर्ण है
Volume Analysis में केवल Activity नहीं, Activity का Result भी देखें।
मान लीजिए:
Situation A
Volume कम हो रहा है।
लेकिन Price लगातार अच्छे Strong Moves से ऊपर जा रहा है।
Situation B
Volume कम हो रहा है।
Price मुश्किल से थोड़ा-थोड़ा ऊपर जा रहा है।
Candles छोटी हैं।
Upper Wicks बढ़ रही हैं।
दोनों में:
Price ↑ + Volume ↓
है।
लेकिन Market Behaviour अलग है।
Trend के बीच और Trend के अंत में अंतर
Rising Price + Falling Volume Trend के बीच भी दिखाई दे सकता है।
Trend के Potential End के आसपास भी।
इसलिए Location देखें।
अगर Price:
Recent Support के ऊपर,
Healthy Structure में,
और Fresh Trend Leg में है,
तो एक Context है।
अगर Price:
बहुत Extended है,
Major Resistance पर है,
और Rejection दिखा रहा है,
तो दूसरा Context है।
Extended Rally में Rising Price + Falling Volume
मान लीजिए Price:
₹100 → ₹130 → ₹160 → ₹190
तक पहले ही काफी ऊपर आ चुका है।
अब:
₹190 → ₹195 → ₹198 → ₹200
जाता है।
लेकिन Volume लगातार कम हो रहा है।
साथ में Candles छोटी हो रही हैं।
यह संकेत दे सकता है कि Price Higher Levels पर जा तो रहा है लेकिन Participation और Price Progress कमजोर हो रही है।
अगर इसके बाद Strong Rejection आता है, तो Situation महत्वपूर्ण हो सकती है।
क्या यह Bearish Divergence है?
Price ऊपर और Volume नीचे होने को सामान्य बातचीत में Price-Volume Divergence जैसा Behaviour कहा जा सकता है।
लेकिन इसे अकेले Traditional Indicator Divergence की तरह Mechanical Signal नहीं मानना चाहिए।
यह हमें बस बताता है:
Price Direction और Volume Direction एक-दूसरे को Confirm नहीं कर रहे।
इस Observation के बाद Price Confirmation जरूरी है।
Support से Bounce में Falling Volume
मान लीजिए Price Support से Bounce करता है।
Price ऊपर जा रहा है लेकिन Bounce के दौरान Volume लगातार कम है।
यह जरूरी नहीं कि Bounce Fail होगा।
लेकिन अगर Price Important Resistance तक पहुँचते-पहुँचते Participation और Price Progress दोनों कमजोर हो जाएँ, तो Trader ज्यादा सावधानी रख सकता है।
Sideways Market में Rising Price + Falling Volume
Range:
Support = ₹400
Resistance = ₹430
Price:
₹405 → ₹415 → ₹425
तक जाता है।
Volume घटता जाता है।
यह Range के अंदर सामान्य Movement भी हो सकता है।
₹430 के पास असली Test होगा।
अगर Breakout पर Volume Expand होता है और Price Sustain करता है, तो Picture बदल सकती है।
अगर Rejection मिलता है, तो Falling Participation का Context ज्यादा Relevant हो सकता है।
Rising Price + Falling Volume और Trend Continuation
यह Combination हमेशा Trend Weakness नहीं बताता।
कई बार Strong Move के बाद Market धीरे-धीरे Higher Drift करता है।
फिर छोटा Pullback आता है।
फिर Fresh Volume Expansion के साथ नया Up Move शुरू होता है।
इसलिए पूरी Sequence देखना जरूरी है।
Volume अचानक वापस बढ़ जाए तो?
मान लीजिए:
Price लगातार ऊपर।
Volume लगातार नीचे।
फिर Important Resistance Break होते ही Volume अचानक Average से 3x हो जाता है।
अब Context बदल गया।
पहले:
Rising Price + Falling Volume
था।
अब:
Breakout + Volume Expansion
है।
Volume Analysis Static नहीं है।
नई Candle आने पर नई Information के अनुसार Analysis Update करना चाहिए।
Falling Volume कितना महत्वपूर्ण है?
सिर्फ यह देखना कि Volume:
100K से 95K
हुआ, पर्याप्त नहीं।
हमें Meaningful Trend देखना चाहिए।
उदाहरण:
500K
420K
330K
250K
170K
इस प्रकार लगातार Volume Contraction ज्यादा स्पष्ट है।
लेकिन Time-of-Day और Market Conditions भी ध्यान में रखें।
Intraday में सावधानी
Intraday में Volume Naturally पूरे Session में बदलता है।
Opening के समय Volume High हो सकता है।
Midday में कम हो सकता है।
इसलिए अगर Price सुबह से दोपहर तक बढ़ रहा है और Volume कम हो रहा है, तो इसका कुछ हिस्सा:
Normal Intraday Volume Pattern
भी हो सकता है।
इसे तुरंत Bearish Divergence नहीं मानना चाहिए।
5-Minute Chart Example
मान लीजिए 5-Minute Chart:
9:30 — Price ₹100 — Volume 4L
9:35 — Price ₹103 — Volume 3.5L
9:40 — Price ₹106 — Volume 2.8L
9:45 — Price ₹108 — Volume 2L
9:50 — Price ₹110 — Volume 1.5L
Price लगातार ऊपर है।
Volume कम हो रहा है।
अब अगर ₹110 Major Resistance है, तो Trader Price Reaction पर ध्यान देगा।
अगर ₹110 Strong Volume से Break हो जाए, Analysis बदल जाएगा।
अगर वहाँ Strong Rejection आए, Falling Participation का Context ज्यादा महत्वपूर्ण हो सकता है।
क्या यहाँ तुरंत Sell करना चाहिए?
नहीं।
यह Volume Analysis की सबसे बड़ी Mistakes में से एक है।
Price ↑ + Volume ↓
का मतलब:
SELL
नहीं है।
यह केवल बताता है कि Up Move के साथ Trading Activity कम हो रही है।
Actual Trade के लिए:
Trend
Location
Structure
Candle Confirmation
और Risk Management
जरूरी हैं।
Reversal Confirmation कैसे मिल सकती है?
मान लीजिए Rising Price + Falling Volume Major Resistance के पास दिखाई देता है।
अब Reversal के लिए Trader अतिरिक्त Evidence देख सकता है:
Resistance Rejection
Long Upper Wick
Bearish Engulfing
Previous Swing Low Break
Lower High Formation
Down Move में Volume Expansion
इनमें से Price Structure जितना ज्यादा Confirm करेगा, Analysis उतना Meaningful हो सकता है।
Rising Price + Falling Volume पढ़ने का Step-by-Step तरीका
Step 1: Trend देखें
Existing Uptrend है या केवल Range Move?
Step 2: Price Structure देखें
Higher High/Higher Low अभी intact हैं?
Step 3: Volume Sequence देखें
Volume वास्तव में लगातार घट रहा है?
Step 4: Average Volume से Compare करें
Current Volume कितना Low है?
Step 5: Time-of-Day देखें
Intraday में Natural Volume Decline तो नहीं?
Step 6: Location देखें
Price Major Resistance के पास है?
Step 7: Candle Bodies देखें
Price Progress Strong है या कमजोर?
Step 8: Wicks देखें
Higher Prices पर Rejection आ रहा है?
Step 9: Confirmation देखें
Price Structure वास्तव में बदल रहा है?
Step 10: Fresh Volume देखें
Opposite Move में Volume Expand हो रहा है या नहीं?
Common Mistakes
1. Price Up + Volume Down = Sell मान लेना
यह सबसे बड़ी गलती है।
2. Strong Uptrend Ignore करना
Bullish Structure intact होने पर केवल Volume से Reversal नहीं मानें।
3. Resistance नहीं देखना
Location इस Combination का Meaning बदल देती है।
4. Intraday Time Effect Ignore करना
Morning से Midday Volume Naturally घट सकता है।
5. Candle Structure Ignore करना
Small Bodies और Upper Wicks महत्वपूर्ण हो सकते हैं।
6. Confirmation से पहले Short करना
Weak Participation और Confirmed Reversal अलग चीजें हैं।
7. बाद में आए Volume Expansion को Ignore करना
Market नई Information के साथ बदलता रहता है।
सबसे जरूरी बातें
Rising Price + Falling Volume का Basic Meaning है:
Price ऊपर जा रहा है लेकिन Trading Participation कम हो रही है।
यह:
Weakening Participation
का संकेत हो सकता है।
लेकिन:
Rising Price + Falling Volume ≠ Sell Signal
Falling Volume ≠ Confirmed Reversal
Falling Volume ≠ Buyers खत्म
इस Combination को हमेशा देखें:
Trend + Location + Price Structure + Candle Behaviour + Confirmation
के साथ।
निष्कर्ष
Rising Price + Falling Volume Volume Analysis का एक महत्वपूर्ण लेकिन अक्सर गलत समझा जाने वाला Combination है।
Price का ऊपर जाना Bullish Direction दिखाता है, जबकि Falling Volume बताता है कि उस Move के दौरान Trading Activity कम हो रही है।
Major Resistance, Extended Rally, Shrinking Candle Bodies और Upper Wicks के साथ यह Situation सावधानी का संकेत दे सकती है।
लेकिन Strong Uptrend में Price Falling Volume के साथ भी आगे बढ़ सकता है।
इसलिए केवल Volume देखकर Reversal Predict करना सही तरीका नहीं है।
सबसे महत्वपूर्ण सवाल है:
“Volume कम हो रहा है, लेकिन Price वास्तव में कमजोर हो रहा है या अभी भी Strong Structure बनाए हुए है?”
जब Falling Volume के साथ Price Rejection, Structure Breakdown और Opposite Direction में Fresh Volume Expansion दिखाई दे, तब Situation ज्यादा Meaningful हो सकती है।
यही Difference केवल Volume Bars देखने और Price-Volume Behaviour को समझने में है।