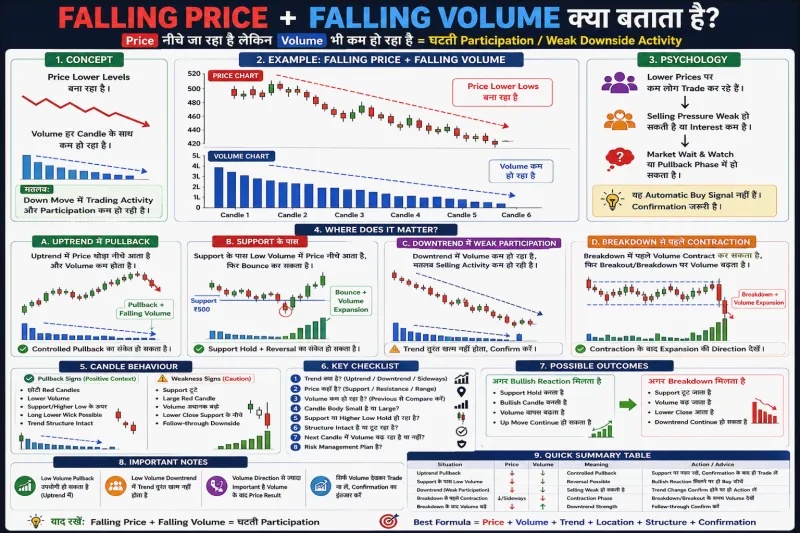
Falling Price + Falling Volume क्या बताता है? पूरी जानकारी हिंदी में
Volume Analysis में एक ऐसी Situation भी आती है जहाँ:
Falling Price + Falling Volume
यानी:
Price लगातार नीचे जा रहा है
लेकिन उसी समय:
Volume भी लगातार कम हो रहा है।
पहली नजर में इसे देखकर कई Traders सोचते हैं:
“Volume कम हो रहा है, इसलिए Selling खत्म हो रही है और अब Price ऊपर जाएगा।”
लेकिन यह Interpretation हमेशा सही नहीं है।
Falling Price + Falling Volume कई अलग-अलग Market Conditions में दिखाई दे सकता है:
- Uptrend के अंदर Controlled Pullback
- Downtrend में कमजोर होती Participation
- Sideways Market
- Consolidation
- Low Liquidity Period
- Trend Pause
- Support की तरफ Slow Decline
- Breakdown से पहले Volume Contraction
इसलिए केवल Price और Volume की Direction देखकर Buy या Sell करना सही तरीका नहीं है।
सबसे महत्वपूर्ण सवाल है:
“Price क्यों गिर रहा है, कहाँ गिर रहा है और कम Volume के बावजूद Market Structure क्या बता रहा है?”
Falling Price क्या होता है?
मान लीजिए किसी Stock का Price:
₹500
₹495
₹490
₹485
₹480
होता जा रहा है।
Price धीरे-धीरे Lower Levels पर जा रहा है।
इसे:
Falling Price
कहा जा सकता है।
लेकिन केवल Price गिरने से यह जरूरी नहीं कि Market Strong Downtrend में है।
यह किसी Uptrend का छोटा Pullback भी हो सकता है।
Falling Volume क्या होता है?
अब उसी दौरान Volume देखें:
5 लाख
4 लाख
3 लाख
2 लाख
1 लाख
यानी Price गिरने के साथ Trading Activity लगातार कम होती जा रही है।
इसे:
Falling Volume
कहा जाता है।
अब दोनों को Combine करें:
Price ↓ + Volume ↓
यही Falling Price + Falling Volume है।
इसका Basic Meaning क्या है?
इसका सबसे Basic Meaning है:
Price नीचे जा रहा है लेकिन Down Move के दौरान Trading Participation कम हो रही है।
यह Observation महत्वपूर्ण है।
लेकिन इसका मतलब सीधे:
“Selling खत्म हो गई”
या:
“अब Buy करना चाहिए”
नहीं है।
Volume हमें Activity बताता है।
Actual Direction और Trade Decision के लिए Price Structure और Location देखना जरूरी है।
आसान Example
मान लीजिए:
| Candle | Close Price | Volume |
|---|---|---|
| 1 | ₹120 | 5 लाख |
| 2 | ₹118 | 4 लाख |
| 3 | ₹116 | 3 लाख |
| 4 | ₹114 | 2 लाख |
| 5 | ₹112 | 1 लाख |
यहाँ:
Price ↓
और:
Volume ↓
दोनों साथ चल रहे हैं।
इससे पता चलता है कि Price Lower Levels पर जा रहा है लेकिन Trading Activity लगातार कम हो रही है।
Market Psychology
अब इसकी Psychology समझते हैं।
अगर Price नीचे जा रहा है लेकिन Volume कम हो रहा है, तो इसका मतलब Down Move के साथ Activity Expand नहीं हो रही।
यानी गिरावट तो जारी है, लेकिन Market में उस गिरावट के दौरान Transactions की मात्रा कम होती जा रही है।
कुछ Context में यह Down Move में कमजोर Participation दिखा सकता है।
लेकिन:
Weak Participation ≠ Confirmed Reversal
Price कम Volume पर भी काफी नीचे जा सकता है।
क्या Falling Volume का मतलब Sellers खत्म हो गए?
नहीं।
यह कहना:
“Volume कम है इसलिए Sellers खत्म हो गए।”
बहुत Simplified Interpretation है।
हर completed transaction में Buyer और Seller दोनों होते हैं।
Volume कम होने का सही Basic Meaning है:
Overall Trading Activity कम है।
अब उस कम Activity का Price पर क्या असर हो रहा है, यह Price Behaviour से समझेंगे।
Uptrend में Falling Price + Falling Volume
यह इस Combination का सबसे महत्वपूर्ण Context है।
मान लीजिए Market Strong Uptrend में है।
Price:
₹100 → ₹110 → ₹120
तक Strong Move देता है।
अब छोटा Pullback आता है:
₹120 → ₹118 → ₹116 → ₹114
और Volume:
4 लाख → 3 लाख → 2 लाख → 1 लाख
होता जाता है।
यहाँ:
Price गिर रहा है
लेकिन:
Volume भी कम हो रहा है।
अगर Bullish Structure अभी भी Intact है, तो यह:
Controlled Pullback
का Context हो सकता है।
Controlled Pullback क्या है?
Uptrend में Price हमेशा सीधी Line में ऊपर नहीं जाता।
अक्सर Structure ऐसा होता है:
Strong Up Move
↓
Small Pullback
↓
Fresh Up Move
Pullback के दौरान अगर:
- Candles छोटी हों
- Volume कम हो
- Price Important Support के ऊपर हो
- Higher Low Structure बचा हो
तो Pullback comparatively Controlled दिखाई दे सकता है।
लेकिन इसे Buy Signal नहीं मानेंगे।
Healthy Uptrend का Example
मान लीजिए:
Price:
₹100 → ₹120
Volume Up Move में High।
अब:
₹120 → ₹114
Pullback आता है।
Pullback में Volume लगातार कम।
₹114 Important Support/Higher-Low Area है।
फिर वहाँ:
Strong Green Candle
बनती है।
Volume दोबारा Expand होता है।
Price:
₹114 → ₹125
जाता है।
अब Sequence देखें:
Strong Up Move + Higher Volume
↓
Pullback + Falling Volume
↓
Support Hold
↓
Bullish Confirmation
↓
Fresh Up Move + Volume Expansion
यह Trend Continuation का महत्वपूर्ण Context हो सकता है।
Pullback में Low Volume क्यों महत्वपूर्ण हो सकता है?
अगर Strong Uptrend के बाद Price थोड़ा नीचे आता है लेकिन गिरावट में Trading Activity कम होती जाती है, तो Down Move में Participation Expand नहीं हो रही।
यह कुछ Situations में बताता है कि Pullback Strong Aggressive Downside Move जैसा नहीं दिख रहा।
लेकिन हमें फिर भी Confirmation चाहिए।
Pullback कब Dangerous हो सकता है?
मान लीजिए शुरुआत में Pullback Low Volume पर था।
लेकिन अचानक:
Important Support Break होता है।
Large Red Candle बनती है।
Volume तेजी से Expand होता है।
Price Support के नीचे Strong Close देता है।
अब Situation बदल गई।
पहले:
Falling Price + Falling Volume
था।
अब:
Support Breakdown + Rising Volume
है।
इसलिए Analysis हमेशा नई Candles के साथ Update करना चाहिए।
Support के पास Falling Price + Falling Volume
मान लीजिए Support:
₹500
है।
Price:
₹530 → ₹520 → ₹510 → ₹503
तक धीरे-धीरे नीचे आ रहा है।
Volume लगातार कम हो रहा है।
अब क्या ₹500 पर Buy कर देना चाहिए?
नहीं।
पहले Support Reaction देखें।
Support Hold होने पर
Price ₹500 के आसपास आता है।
Volume Low है।
फिर Strong Green Candle:
₹502 → ₹515
बनती है।
Volume अचानक Average से ज्यादा हो जाता है।
अब:
Falling Price
Falling Volume
Important Support
Bullish Reaction
Fresh Volume Expansion
एक ज्यादा Meaningful Context बनाते हैं।
Support Break होने पर
अब वही Price ₹500 तक Low Volume में आता है।
लेकिन फिर:
₹500 Break
Strong Red Candle
Close ₹490
Volume अचानक High
अगली Candle ₹480
अब पुराना Falling Volume Analysis Relevant नहीं रहा।
Market ने नई Information दे दी।
इसलिए:
Volume Analysis Dynamic होता है।
Downtrend में Falling Price + Falling Volume
अब सबसे ज्यादा Confusion यहीं होता है।
मान लीजिए Market पहले से Strong Downtrend में है:
Lower High
Lower Low
Lower High
Lower Low
बन रहे हैं।
अब Price गिर रहा है और Volume कम हो रहा है।
Beginners सोच सकते हैं:
“Selling कमजोर हो गई, अब Reversal आएगा।”
लेकिन जरूरी नहीं।
Downtrend Low Volume पर भी Continue कर सकता है।
Downtrend में इसका Meaning
Existing Downtrend में Falling Price + Falling Volume यह दिखा सकता है कि Down Move में Participation कम हो रही है।
लेकिन जब तक:
Lower High टूटता नहीं
Higher High नहीं बनता
Important Resistance reclaim नहीं होता
या:
Bullish Confirmation नहीं मिलता
तब तक केवल Volume के आधार पर Trend Reversal नहीं मानेंगे।
कमजोर Selling और Reversal में अंतर
यह बहुत महत्वपूर्ण है।
Weakening Downside Participation
और:
Bullish Reversal
एक ही चीज नहीं हैं।
पहला सिर्फ Observation है।
दूसरे के लिए Price Structure Change चाहिए।
इसलिए:
Selling Weak हो सकती है लेकिन Price फिर भी नीचे जा सकता है।
Sideways Market में Falling Price + Falling Volume
मान लीजिए Range है:
Resistance = ₹550
Support = ₹500
Price:
₹540 → ₹530 → ₹520 → ₹510
तक आता है।
Volume कम होता जा रहा है।
Price अभी भी Range के अंदर है।
इस Situation में Support ₹500 के पास Reaction ज्यादा महत्वपूर्ण होगा।
Low Volume Fall अकेले Trade Signal नहीं है।
Consolidation में Falling Volume
Consolidation के दौरान अक्सर Overall Volume कम हो सकता है।
Price थोड़ा ऊपर-नीचे होता रहता है।
Volume धीरे-धीरे Contract करता है।
इसका मतलब Market में Activity कम हो रही है।
ऐसी Situation में अगला महत्वपूर्ण सवाल है:
Range किस Direction में Break होगी?
Direction Volume Contraction से अकेले तय नहीं होती।
Breakout से पहले Volume Contraction
मान लीजिए Price Consolidation में है।
Volume धीरे-धीरे कम हो रहा है।
Price थोड़ा Lower Drift कर रहा है।
फिर अचानक Resistance Break होता है और Volume Expand होता है।
अब पहले का Falling Price + Falling Volume केवल Consolidation का हिस्सा था।
इसलिए Context के बिना इसे Bearish नहीं कहा जा सकता।
Breakdown से पहले भी ऐसा हो सकता है
उल्टा भी संभव है।
Price धीरे-धीरे नीचे।
Volume धीरे-धीरे कम।
फिर Important Support Break होते ही:
Large Red Candle
Huge Volume Expansion
आता है।
इसलिए Falling Volume यह नहीं बताता कि अगला Break ऊपर ही होगा।
Candle Body का महत्व
मान लीजिए Price गिर रहा है और Volume कम हो रहा है।
अब Candle Bodies देखें।
छोटी Red Candles + Falling Volume
Controlled/Slow Decline का Context हो सकता है।
बड़ी Red Candles + Falling Volume
Price Significant Distance गिर रहा है, भले Activity कम हो।
इसलिए केवल Volume नहीं, Price Result भी देखें।
Small Red Candles + Low Volume
Uptrend Pullback में यह Behaviour विशेष रूप से उपयोगी हो सकता है।
उदाहरण:
Strong Green Move
↓
Small Red Candle
↓
Small Red Candle
↓
Small Red Candle
और हर Candle के साथ Volume कम।
अगर Price Higher-Low Area पर है, तो Pullback Controlled दिखाई दे सकता है।
फिर Bullish Confirmation का इंतजार किया जा सकता है।
Long Lower Wick + Low Volume
अगर Support के पास Falling Price + Falling Volume के बाद Long Lower Wick बनती है, तो Lower Prices पर Rejection का Observation मिल सकता है।
लेकिन अगर Volume बहुत Low है, तो उस Reaction की Strength को अकेले Wick से नहीं मापना चाहिए।
अगली Candles ज्यादा Information देंगी।
Falling Price + Falling Volume के बाद Volume Expansion
इस Combination को समझने का सबसे अच्छा तरीका है यह देखना कि:
Volume दोबारा किस Direction में Expand होता है?
मान लीजिए Pullback Low Volume में था।
फिर Strong Green Candle पर Volume Expand हुआ।
यह Bullish Continuation Context हो सकता है।
लेकिन अगर:
Strong Red Breakdown Candle पर Volume Expand हुआ,
तो Bearish Context बन सकता है।
यानी:
Contraction के बाद Expansion की Direction महत्वपूर्ण है।
Price Progress भी देखें
मान लीजिए:
Volume:
5L → 4L → 3L → 2L
गिर रहा है।
लेकिन Price:
₹500 → ₹490 → ₹470 → ₹440
बहुत तेजी से नीचे जा रहा है।
भले Volume कम हो रहा हो, Price Result काफी Bearish है।
इसे केवल:
“Volume गिर रहा है इसलिए Selling Weak है”
कहना सही नहीं होगा।
दूसरा Example
अब Price:
₹500 → ₹497 → ₹495 → ₹494
और Volume:
5L → 4L → 3L → 2L
यहाँ:
Price Progress भी बहुत कम है।
Volume भी कम है।
यह Slow/Controlled Decline जैसा Behaviour है।
इसलिए:
Volume के साथ Price Distance भी Compare करें।
Effort और Result
Volume Analysis में इसे आसान तरीके से ऐसे सोच सकते हैं:
Volume = Activity / Effort
Price Movement = Result
अगर Activity कम हो रही है और Price भी बहुत कम गिर रहा है, तो Down Move में Momentum कमजोर दिखाई दे सकता है।
अगर Activity कम है लेकिन Price बहुत तेजी से गिर रहा है, तो Context अलग है।
Falling Price + Falling Volume और Higher Low
मान लीजिए Uptrend में Previous Swing Low:
₹100
है।
Price ₹120 से Pullback करके:
₹108
तक आता है।
Volume कम हो रहा है।
Price ₹100 के ऊपर ही Hold करता है।
फिर ₹108 से Strong Bullish Move आता है।
अब ₹108:
Higher Low
बन सकता है।
यह Price Structure Trend Continuation के लिए Volume से भी ज्यादा महत्वपूर्ण Confirmation है।
Previous Low टूट जाए तो?
अगर Price:
₹120 → ₹108
Low Volume Pullback करता है।
लेकिन बाद में:
₹100 Previous Low
Break कर देता है।
और Volume भी Expand होता है।
तो Bullish Structure कमजोर हो गया।
इसलिए केवल शुरुआती Low Volume Pullback देखकर Position में फँसे नहीं रहना चाहिए।
Intraday में Falling Price + Falling Volume
Intraday में यह Combination बहुत Common है।
लेकिन Time-of-Day बहुत महत्वपूर्ण है।
Market Open पर Volume High हो सकता है।
फिर Midday तक Volume Naturally कम होता है।
अगर इसी दौरान Price थोड़ा नीचे Drift करे, तो Chart पर:
Price ↓
Volume ↓
दिखाई देगा।
लेकिन यह जरूरी नहीं कि कोई खास Bullish Signal हो।
5-Minute Chart Example
मान लीजिए Uptrend में Stock:
₹500 → ₹520
Strong Move करता है।
अब 5-Minute Candles:
10:30 — ₹518 — Volume 2.5L
10:35 — ₹516 — Volume 2L
10:40 — ₹514 — Volume 1.5L
10:45 — ₹513 — Volume 1L
Price गिर रहा है।
Volume भी गिर रहा है।
₹512–₹514 Higher-Low/Support Area है।
अब अगर:
10:50 Candle ₹520 के ऊपर Strong Volume से निकलती है,
तो Pullback Continuation Setup का Context मजबूत हो सकता है।
लेकिन अगर ₹512 Strong Volume से टूटता है, तो Analysis बदल जाएगा।
क्या यहाँ सीधे Buy करना चाहिए?
नहीं।
याद रखें:
Price ↓ + Volume ↓ ≠ Buy
यह केवल Observation है।
Trade से पहले देखें:
Support Hold हुआ?
Bullish Candle बनी?
Structure Intact है?
Volume वापस Expand हुआ?
Risk-Reward सही है?
Trend Continuation में Ideal Behaviour
एक Bullish Continuation Context कुछ ऐसा दिख सकता है:
Strong Uptrend
↓
Strong Up Move + Higher Volume
↓
Controlled Pullback
↓
Falling Price + Falling Volume
↓
Higher-Low / Support Hold
↓
Bullish Confirmation
↓
Fresh Volume Expansion
↓
Trend Continues
यह Framework है, Guarantee नहीं।
Bearish Continuation में क्या होगा?
अगर:
Price ↓ + Volume ↓
चल रहा था,
लेकिन फिर:
Important Support Break
Large Red Candle
Fresh Volume Expansion
Strong Lower Close
आ जाता है,
तो Downtrend Continuation का Context बन सकता है।
यानी Low Volume Fall अपने आप Bullish नहीं था।
Falling Price + Falling Volume पढ़ने का Step-by-Step तरीका
Step 1: Existing Trend देखें
Uptrend, Downtrend या Sideways?
Step 2: Price Structure देखें
Higher High/Higher Low या Lower High/Lower Low?
Step 3: Volume Sequence देखें
क्या Volume वास्तव में लगातार कम हो रहा है?
Step 4: Price Progress देखें
Price धीरे गिर रहा है या तेजी से?
Step 5: Candle Size देखें
Small Candles या Large Bearish Candles?
Step 6: Location देखें
Support या Higher-Low Area कहाँ है?
Step 7: Price Reaction देखें
Support Hold हो रहा है?
Step 8: Structure Confirmation देखें
Higher Low बन रहा है या Support टूट रहा है?
Step 9: Volume Expansion देखें
Volume दोबारा किस Direction में बढ़ता है?
Step 10: Risk Management करें
किसी भी Setup की Guarantee नहीं होती।
Common Mistakes
1. Falling Price + Falling Volume देखकर तुरंत Buy करना
यह Buy Signal नहीं है।
2. Volume कम = Sellers खत्म मान लेना
Volume केवल Overall Trading Activity दिखाता है।
3. Existing Downtrend Ignore करना
Downtrend Low Volume पर भी Continue कर सकता है।
4. Support का इंतजार नहीं करना
Location के बिना Interpretation अधूरा है।
5. Price Structure Ignore करना
Higher Low या Lower Low Volume से ज्यादा महत्वपूर्ण हो सकता है।
6. Fresh Volume Expansion Ignore करना
Contraction के बाद Volume किस Direction में आता है, यह महत्वपूर्ण है।
7. Intraday Time Effect Ignore करना
Midday में Volume Naturally कम हो सकता है।
8. केवल Volume देखकर Reversal Predict करना
Price Confirmation जरूरी है।
सबसे जरूरी बातें
Falling Price + Falling Volume का Basic Meaning है:
Price नीचे जा रहा है और Down Move के दौरान Trading Activity कम हो रही है।
Uptrend में यह:
Controlled Pullback
का हिस्सा हो सकता है।
लेकिन Downtrend में:
Trend तुरंत खत्म हो गया
ऐसा नहीं माना जा सकता।
इसलिए:
Price ↓ + Volume ↓ ≠ Buy
Low Volume ≠ Sellers खत्म
Low Volume ≠ Confirmed Reversal
Low Volume Pullback + Support Hold + Bullish Confirmation + Fresh Volume Expansion
एक ज्यादा Meaningful Combination हो सकता है।
सही Formula:
Price + Volume + Trend + Location + Structure + Confirmation
निष्कर्ष
Falling Price + Falling Volume Volume Analysis का बहुत महत्वपूर्ण Combination है, खासकर Pullback को समझने के लिए।
अगर Strong Uptrend में Price Controlled तरीके से नीचे आता है और Volume लगातार कम होता है, तो यह Pullback में घटती Trading Participation दिखा सकता है।
लेकिन केवल इसी कारण Buy करना सही नहीं है।
पहले यह देखना जरूरी है कि Important Support या Higher-Low Area Hold होता है या नहीं।
अगर वहाँ Bullish Price Confirmation मिले और Fresh Up Move में Volume दोबारा Expand हो, तो Trend Continuation का Context ज्यादा मजबूत हो सकता है।
दूसरी तरफ, अगर Low Volume Decline के बाद Important Support Strong Volume के साथ टूट जाए, तो पूरी कहानी बदल सकती है।
इसलिए Falling Price + Falling Volume देखते समय सबसे उपयोगी सवाल है:
“Volume कम हो रहा है, लेकिन अगला Strong Volume किस Direction में आ रहा है?”
यही सवाल आपको Controlled Pullback, Weak Down Move और Fresh Breakdown के बीच अंतर समझने में मदद करेगा।